
Maneuvering Mobility Infographic
This infographic depicts five cities in the United States that have the most accessible public transportation, while also noting two cities that have the least accessible public transportation. It addresses common myths regarding transportation for people with disabilities and offers alternative, factual statements to rebut the myths. The infographic notes the main ways in which public transportation is inaccessible and also describes ways in which blind and deaf people navigate public transportation.


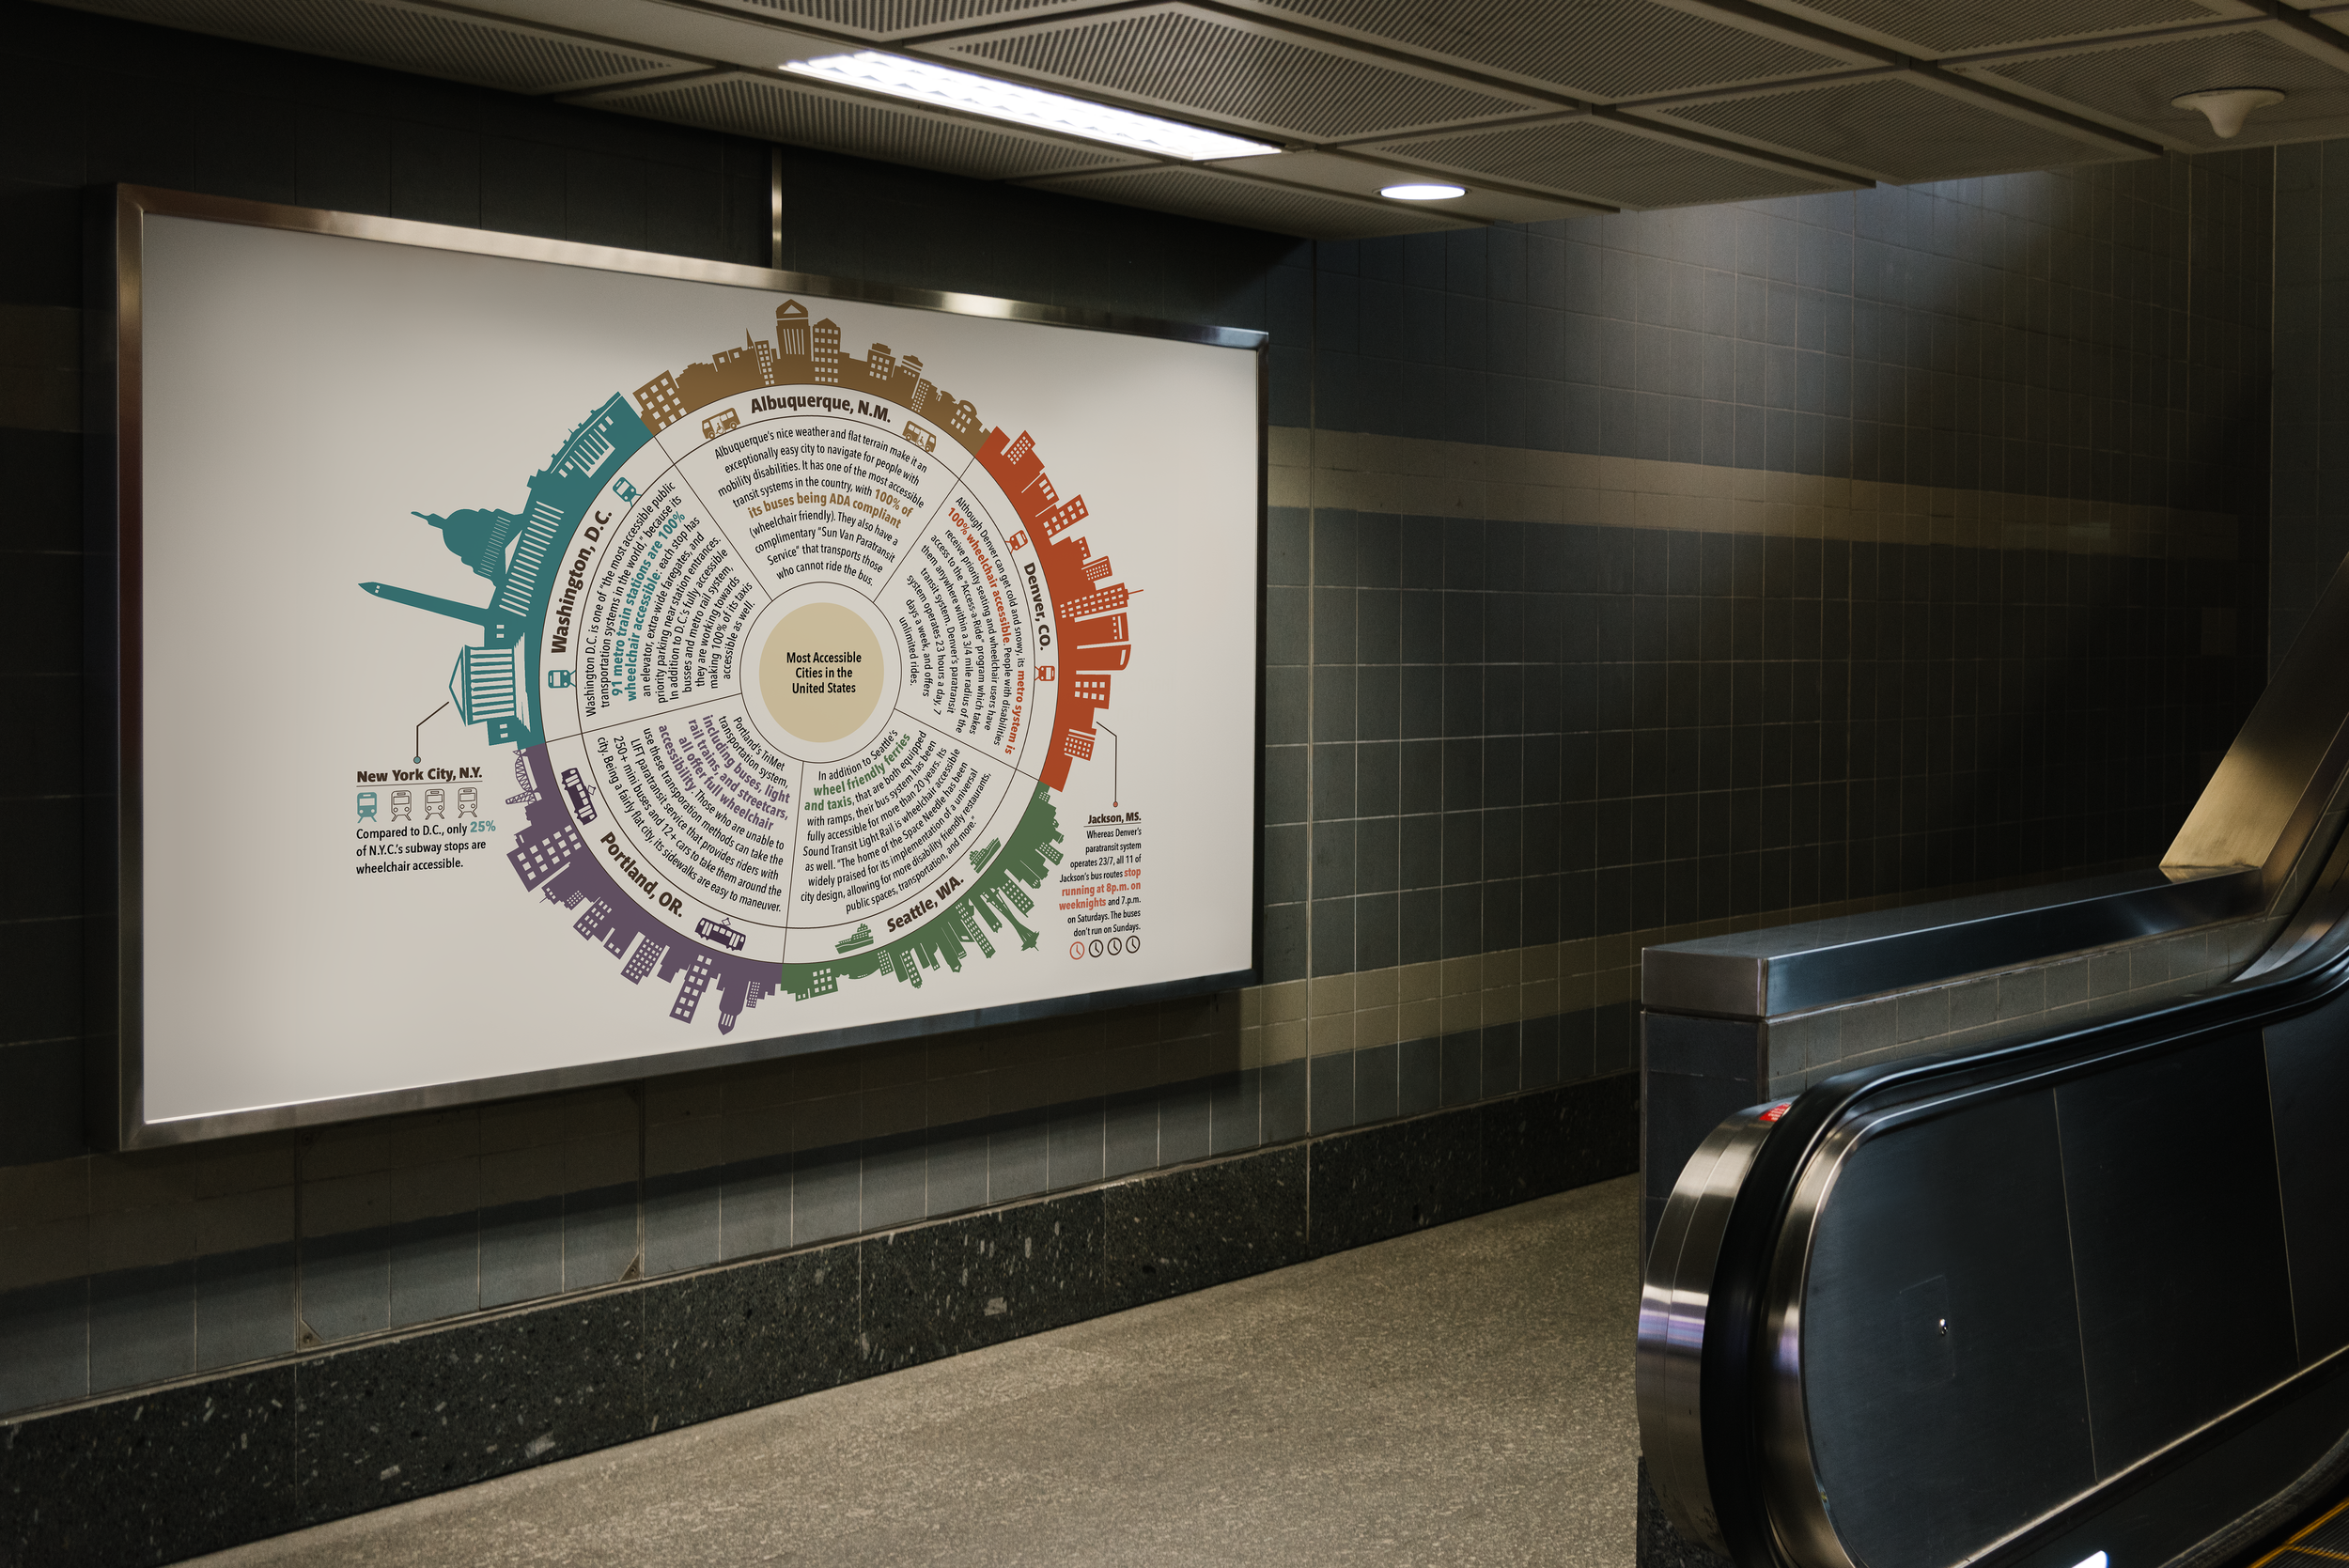

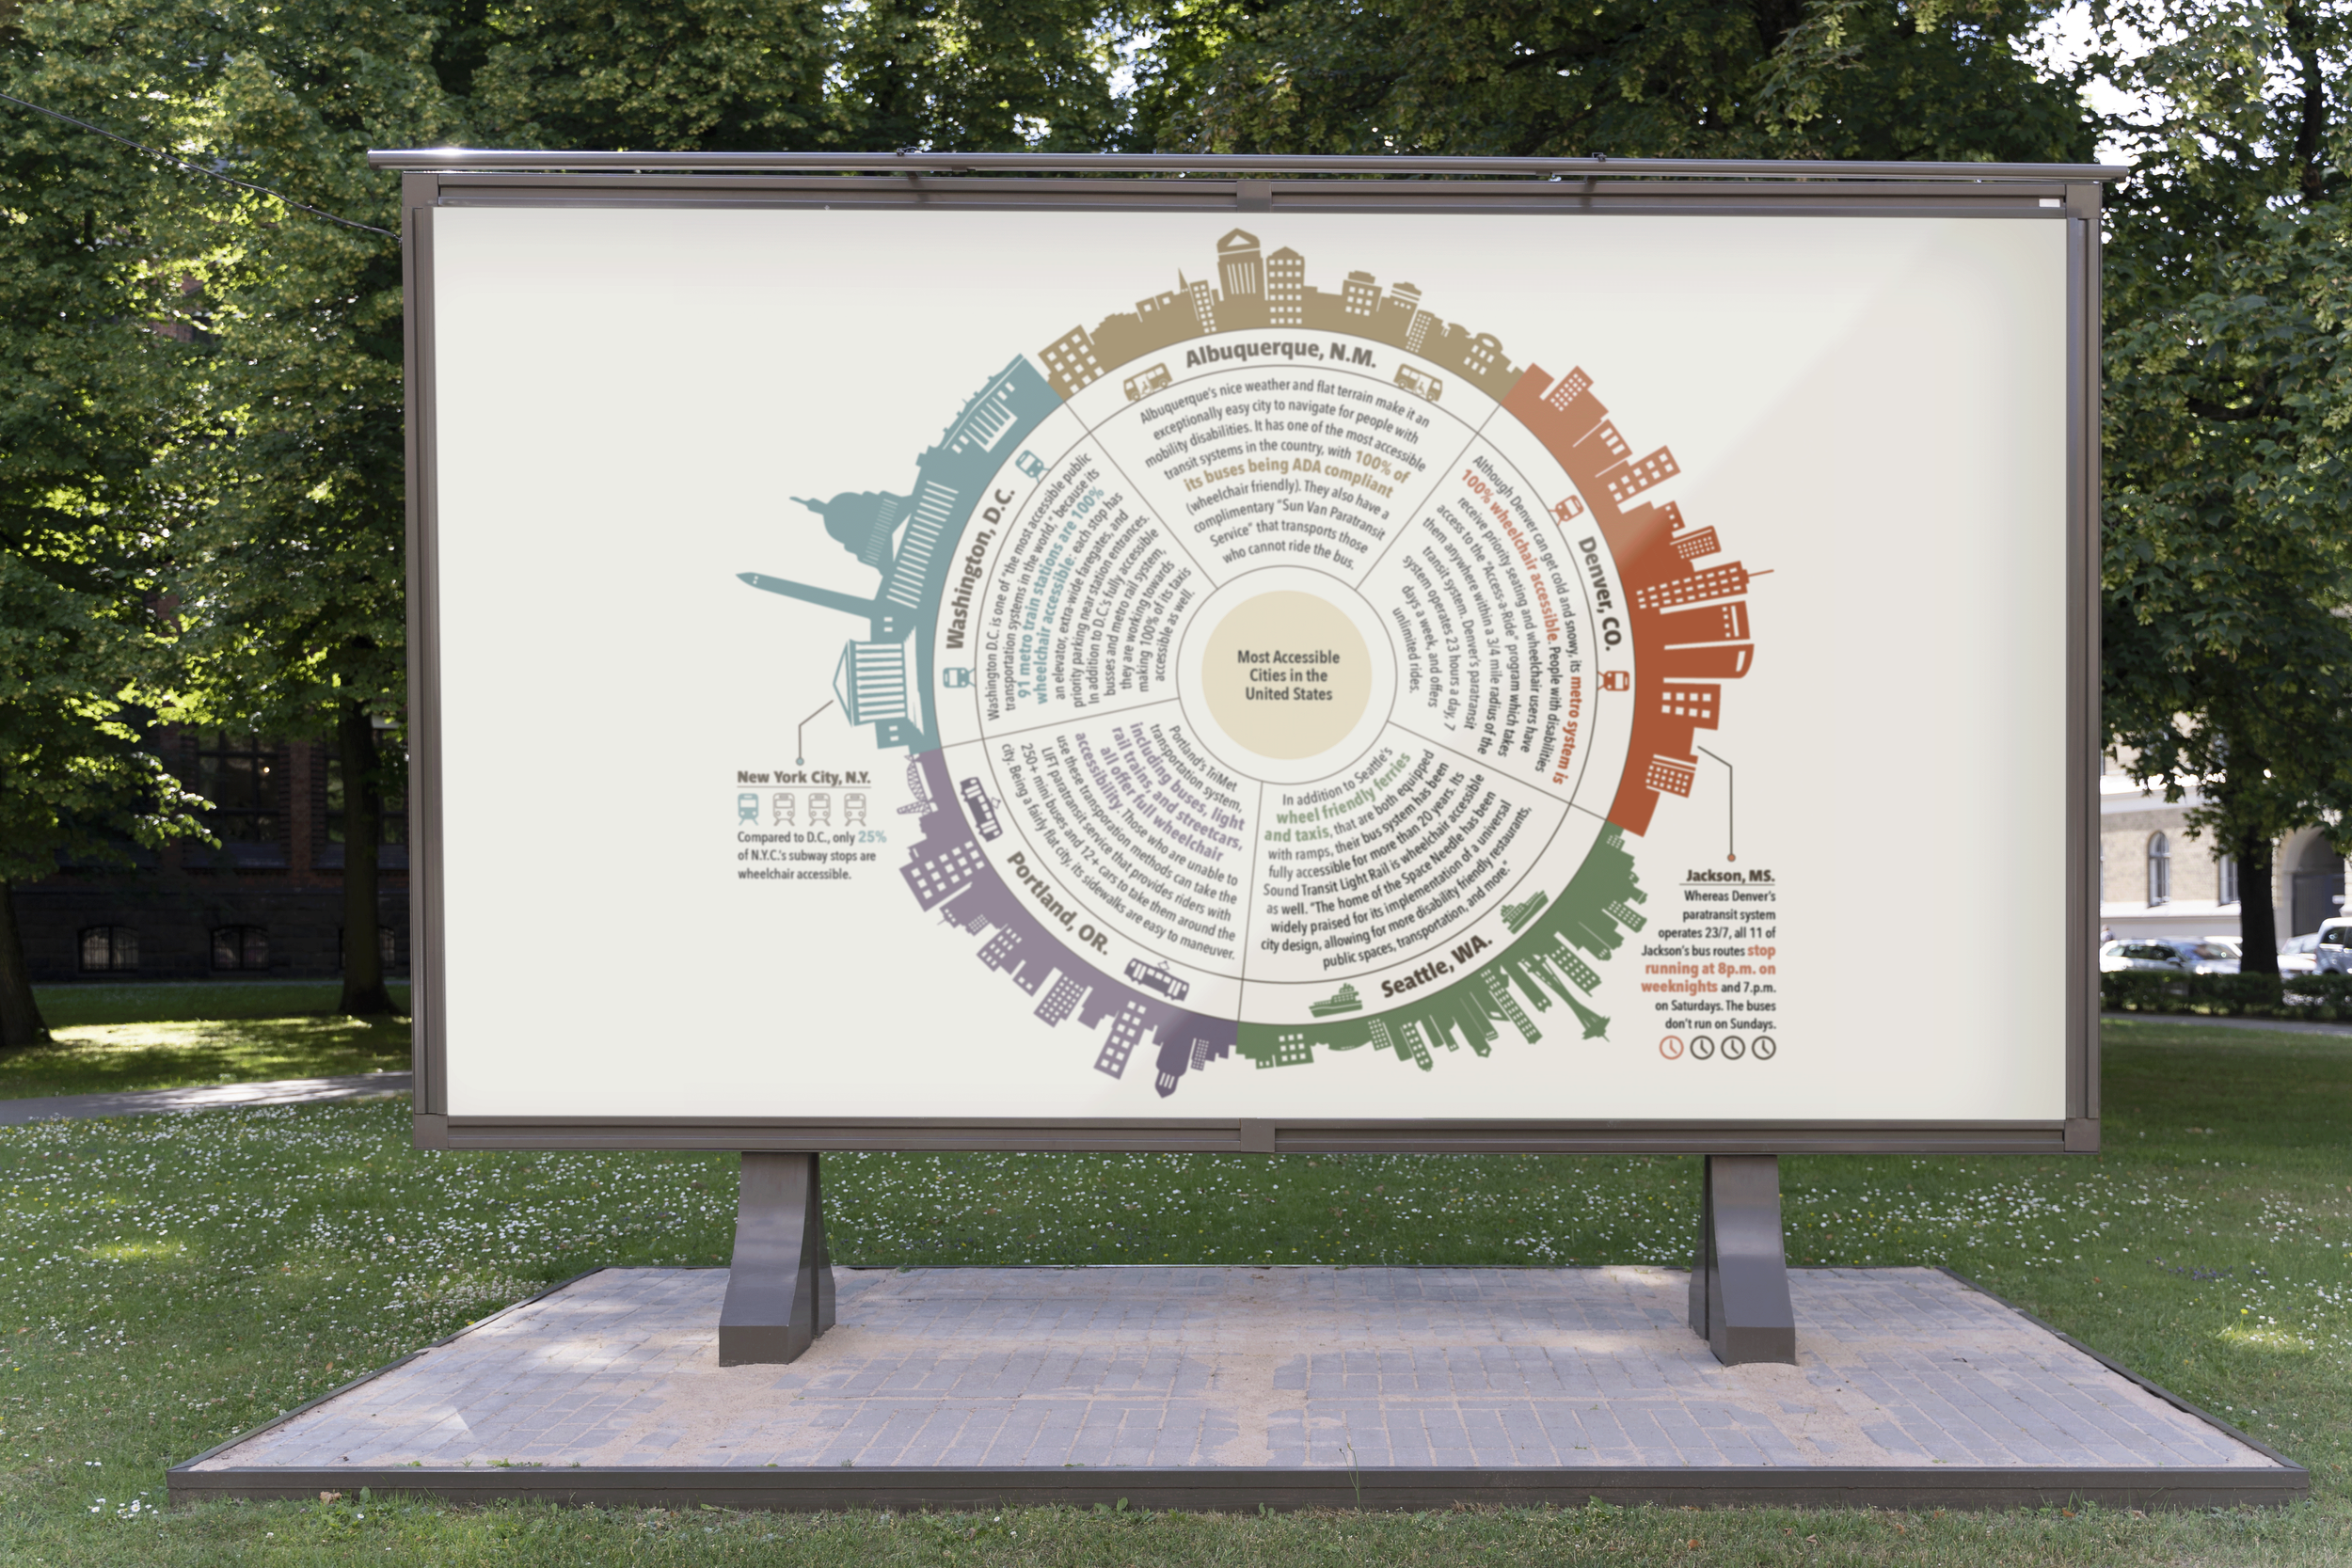
Programs Used: Illustrator